MAURICIO DEL MORAL / PORTFOLIO / WORKCASE STUDY / 02
EJEMPLODE / A PUBLISHING BUSINESS
I built Ejemplode.
Then I had to rebuild it.
From finding a niche in 2007 to more than a billion page views. Building the business, recovering from Panda, losing traffic and rebuilding with AI. The full story, including the parts that did not work.
1.1B+Historical page views on Ejemplode1.41MPage views in one day · 10 Nov 201530+Monetised sites in the wider network
Historical AdSense totals and a recorded daily peak. Network size is shown separately.
01 / 2007 / FINDING THE OPPORTUNITY
I followed the searches.
In late 2006, I started exploring how websites could make money. I had already been building websites for years. This time, I wanted to build something of my own.
I built a keyword research tool around Yahoo Overture. It took a search, found related terms and used those to uncover more searches.
I was looking for demand. What were people trying to do? What did they need help with? Where could a small website find an audience?
I tested different niches. Hotels, insurance and mortgages looked like attractive markets. But smaller sites about letters, memorandums and language did better than those bigger bets.
People needed an example. I could help them find one.
A recommendation letter. A memorandum. A grammar rule explained with words they recognised.
These were specific needs, repeated by many people. I could see the opportunity in the searches and in the response to the sites.
That was the start of Ejemplode.
I launched it in 2007. The idea was simple: make things easier to understand through examples.
Not every experiment deserved to become a business.
Some of my early experiments used automated or scraped content. Rankings disappeared quickly. Keeping those sites alive took more work than the model justified.
That experience pushed me towards original educational publishing. I wanted a business I could develop over time.
02 / BUILDING THE BUSINESS
The website was only part of the work.
I built the proprietary CMS and the tools behind the publishing operation. I also handled the search strategy, editorial direction and advertising revenue.
Those responsibilities were connected. A publishing decision affected search. A technical decision affected what the team could do. Traffic affected what the business earned.
I had to understand all three.
A team that kept learning.
Over the years, I hired and trained many writers. At the busiest point, up to eight worked with me at the same time.
The team changed. People joined, learned and moved on. Training was a continuing part of running the business.
I taught web writing and SEO, reviewed the work and helped writers connect a search query with a useful answer.
The work went beyond choosing keywords. An article needed to explain something clearly, use examples well and fit into the rest of the site.
THE PUBLISHING PROCESS / RECONSTRUCTED FROM MY WORK
Find the demand.Research the searches and the reader’s need.
Brief and train.Turn the topic into a clear editorial task.
Write and review.Check the explanation, examples and on-page SEO.
Publish and connect.Use the CMS and internal links to place the answer.
Measure and improve.Review readership, search performance and revenue.
From one site to a publishing network.
The wider network grew to more than 30 monetised sites. My publishing work included Spanish, Dutch, Portuguese and an early English project.
Different topics and languages gave me more opportunities to test what worked. They also added editorial and technical work.
AdSense was how the audience became a business. Page views mattered because they supported advertising revenue. They were part of the commercial model, not just a number on a dashboard.
I was responsible for the platform, the content, the team and the result.
03 / 2011–2012 / THE FIRST RECOVERY
I removed 50,000 pages.
Panda hit in October 2011. Average daily page views fell 29% in two weeks.
The site had around 50,000 tag and query pages. They were a way of generating more pages from content that already existed.
They created volume. They did not create the same amount of value.
I decided to remove them from the site. That meant working through the URLs and deciding what should happen to each one.
Deleting everything was not the whole job. Where a useful article already answered the same need, I wanted readers and search engines to reach it.
I used spreadsheets, expressions, searches and matching rules to find those destinations. I redirected everything I could match appropriately.
The remaining URLs returned 410: gone.
There was no AI to help me work through the list. It was a huge manual task.
By early 2012, traffic had recovered.
The fall. The recovery.AdSense page views · seven-day averages
Recreated from the archived daily report. Each point averages seven consecutive days. School holidays also affect demand.
View the figures +
The 29% fall compares 30 September–13 October 2011 (173,413 daily average) with 14–27 October (122,603). Both windows contain two of each weekday.
Weekly average daily page views
Week starting
Page views / day
2011-09-01
152,209
2011-09-08
146,809
2011-09-15
142,590
2011-09-22
176,789
2011-09-29
186,035
2011-10-06
163,773
2011-10-13
130,535
2011-10-20
124,455
2011-10-27
92,075
2011-11-03
113,611
2011-11-10
113,218
2011-11-17
103,117
2011-11-24
101,718
2011-12-01
79,379
2011-12-08
66,893
2011-12-15
40,479
2011-12-22
23,359
2011-12-29
36,905
2012-01-05
66,227
2012-01-12
76,238
2012-01-19
96,816
2012-01-26
110,977
2012-02-02
118,126
2012-02-09
127,018
2012-02-16
128,390
2012-02-23
147,854
2012-03-01
157,265
2012-03-08
169,602
2012-03-15
156,818
2012-03-22
173,441
2012-03-29
95,624
2012-04-05
112,535
2012-04-12
181,573
2012-04-19
182,966
2012-04-26
154,786
2012-05-03
197,124
2012-05-10
174,590
2012-05-17
205,810
2012-05-24
219,861
The decision went against the instinct to protect every URL. I had built those pages to bring people in. Now I had to accept that keeping them was part of the problem.
The recovery mattered commercially. It also changed how I thought about a content inventory.
A page needed a reason to exist beyond the possibility of ranking for another query.
More pages did not make a stronger site. I would need that lesson again in 2026 ↓.
04 / THE YEARS THAT FOLLOWED
Growth returned. Then it got big.
Recovering from Panda was not the end of the story. There were years of growth ahead.
Ejemplode went from small niches to competitive search terms. The same approach that started with specific questions grew into broader educational coverage.
I kept working across the content, the platform and search. The business grew around that combination.
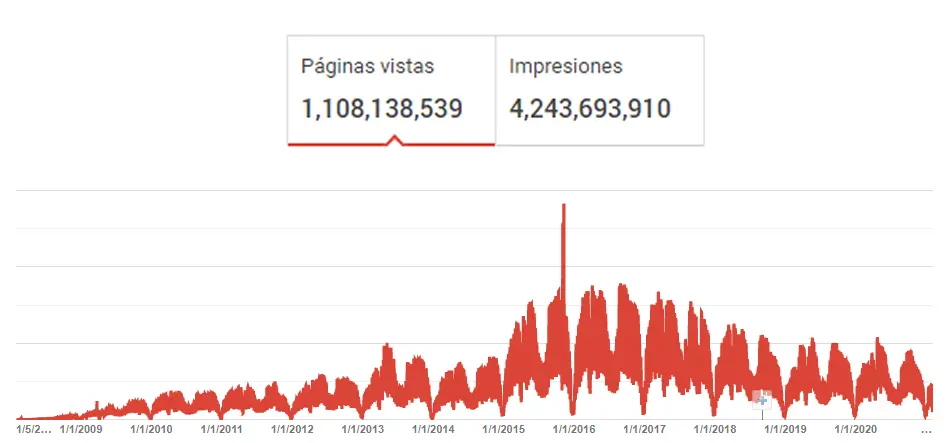
On 10 November 2015, the daily AdSense report recorded 1,414,368 page views.
Over the years, Ejemplode alone passed 1.1 billion page views and 4.2 billion ad impressions.
I had built a business around finding demand, publishing useful answers and turning readership into revenue.
Those figures belong to Ejemplode alone.
The other sites were a separate part of the operation. Their traffic is not added to the figures shown here.
From the first page views to 1.4M a day.Ejemplode · Daily page views · 2007–2015
1,414,368page views in one day10 November 2015
Source: archived daily AdSense report. Actual daily page views from 1 January 2007 to 10 November 2015. The line ends at the recorded peak. Page views count pages loaded, not unique visitors.
See the daily peaks by year +
Highest recorded day in each year shown. 2015 ends on 10 November.
Date
Daily page views
2007-03-19
4,516
2008-12-02
28,664
2009-11-23
122,949
2010-04-13
187,733
2011-10-04
249,444
2012-06-05
297,545
2013-05-07
503,197
2014-11-11
411,320
2015-11-10
1,414,368
See the historical AdSense report +Open original image ↗Original historical capture for Ejemplode alone. These are accumulated page views and ad impressions. The daily peak comes from the separate archived daily export.
At that scale, the decisions behind the site were easy to miss. A graph showed the audience. It did not show the writers being trained, the CMS being maintained or the articles being reviewed.
That work was what made the audience possible.
But success also left me with a large archive and a platform shaped by earlier decisions. They would become harder to change as search evolved.
05 / THE DECLINE / THE FINAL DROP IN 2023–2024
Most of the traffic was already gone.
The decline did not happen in a single day.
Traffic and revenue had been falling for years. There was some recovery during the 2020 lockdown, when more students were online. The site still earned money.
By 2022, it was earning less. Over time, the business lost much of what had made it work.
Some of the historical data is missing. I cannot put an exact date or a single cause on every stage of the decline.
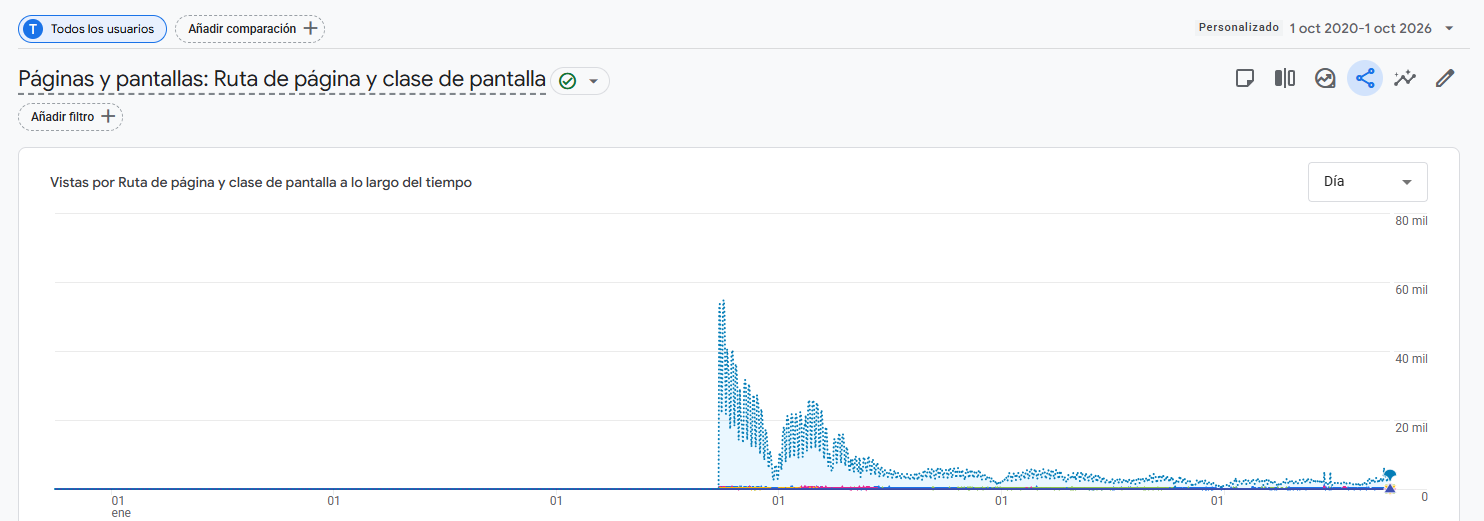
By September 2023, GA4 recorded 52,672 views on a day that once would have felt small.
Nine months later, it recorded 5,325.
52,672GA4 views
→
5,325GA4 views
89.9% lowerTwo daily snapshots, nine months apart. These are individual days, not period averages.
I tried isolated fixes and content clusters. They did not turn things around.
The problem went much deeper.
The final drop.Ejemplode · GA4 views · September 2023–October 2026
Visual reconstruction from the original GA4 screenshot; the curve is approximate. The two dated daily figures above were read from GA4. The earlier period without visible data is omitted.
See the original GA4 screenshot +Open original image ↗GA4 daily views, displayed over 1 October 2020–1 October 2026. The visible data starts in September 2023. The earlier flat line does not establish zero traffic. GA4 and historical AdSense use different measurement systems.
The old model was no longer enough.
A site built around answering questions was now operating in a search environment where more answers could appear without a visit to the source.
That was a business problem. But it was not a reason to ignore the problems inside the site.
Articles overlapped. Some were thin. Others followed SEO rules that no longer made sense. The architecture and the CMS made the work harder.
I could keep improving individual pages. I had already tried that. It was not fixing the whole system.
The next attempt had to be different.
06 / 2026 / STARTING AGAIN
I went back to the whole site.
By 2026, I was not looking for a new homepage. I needed to rethink the content and the platform together.
There was thin content. Pages competing with each other. Weak connections between topics. A CMS built for a different era of search.
There were thousands of articles to review and years of decisions to work through.
Codex made that volume of work possible.
The scale of the work had made a full rebuild difficult to take on manually. With AI supporting the work, I could approach the whole archive and the platform as one project.
I set the direction, reviewed the changes and decided what to keep, combine or remove. Codex helped me carry out the work.
This was a different use of AI from simply generating more articles. I already had a large archive. The job was to make it stronger.
CONTENT
Give each page a job.
I consolidated overlap, removed weak pages and strengthened explanations and evidence of expertise.
~3,800 → ~2,800 editorial articles
STRUCTURE
Connect the answers.
I rebuilt topic clusters, internal links and learning routes so readers could find a useful next step.
PRODUCT
Make the site useful.
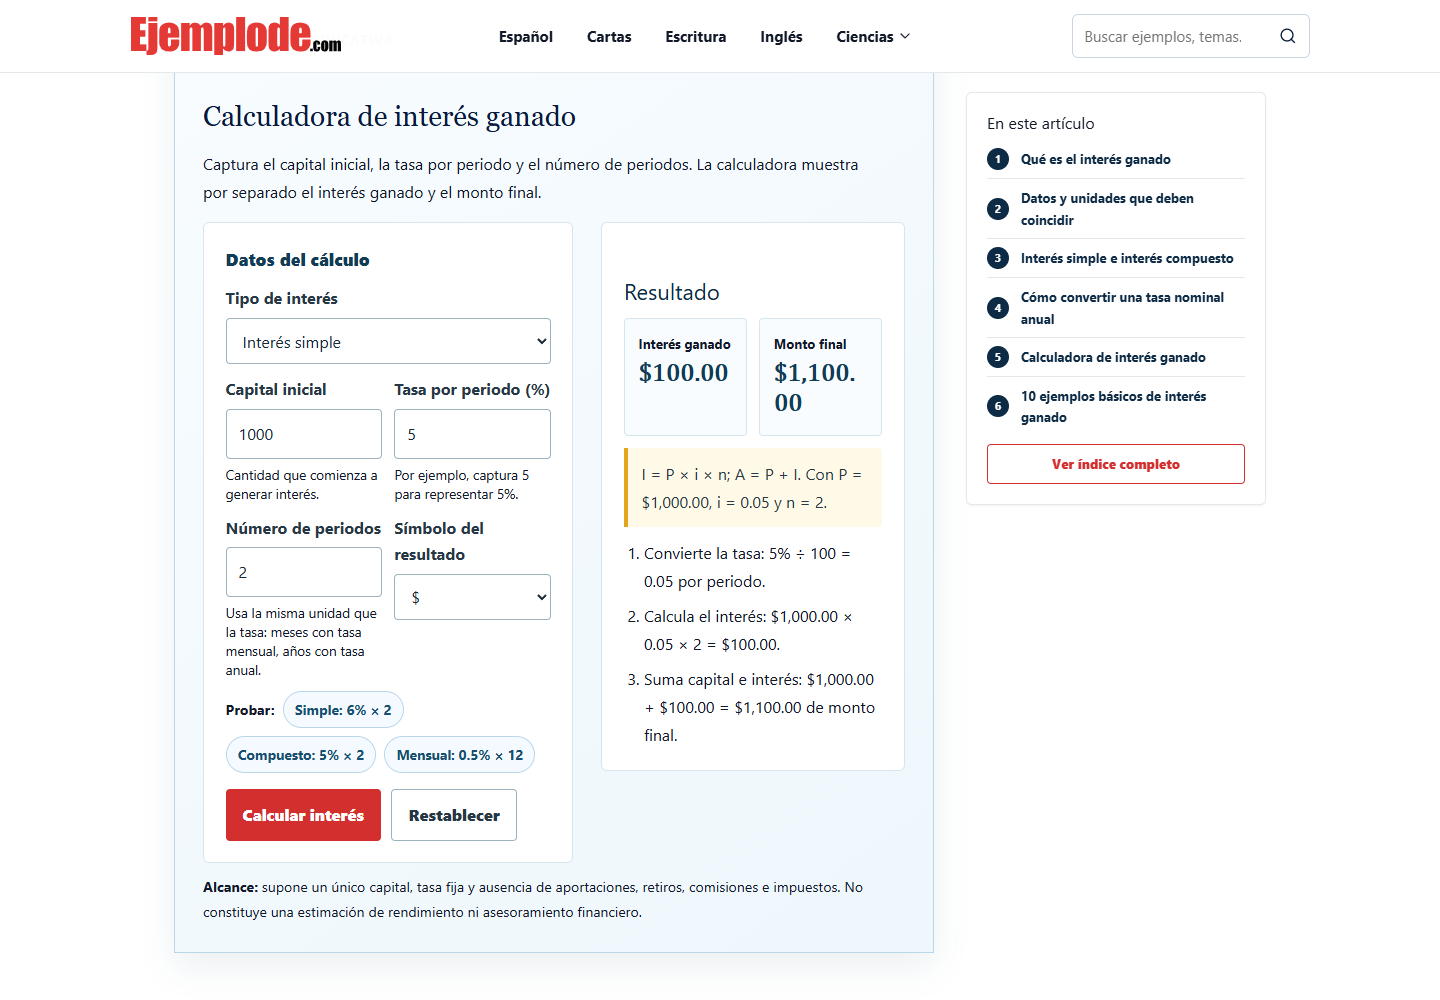
I migrated the custom CMS to WordPress and added practical tools, tests and calculators.
The 2026 article inventory is separate from the 50,000 tag and query URLs removed in 2011.
First, decide what deserves to stay.
I worked through overlapping articles and weak pages. Where several pages were trying to do the same job, I consolidated them.
The editorial inventory went from roughly 3,800 articles to 2,800.
The smaller number was a consequence of the decisions, not the objective. I wanted clearer answers, less duplication and a stronger purpose for each page.
I also worked on the explanations, examples and evidence of expertise. Publishing an answer was not enough. The content needed to give the reader a reason to trust it.
Then, make the answers work together.
I rebuilt the connections between topics, pillar pages and supporting articles.
The question was simple: once someone has read this, what would help them next?
That led to learning routes, clearer navigation and internal links based on the subject. It also changed how I thought about the archive: as connected material, not thousands of separate destinations.
THE REBUILT EXPERIENCE / A SIMPLIFIED MODELA topic and a clear answer
Understand Explanations and examplesKeep learning Related topics and routesPut it into practice Tests and calculators
Rebuild the platform around the work.
I migrated the custom CMS to WordPress. The old system had supported years of growth, but its design and limitations had become part of the problem.
The move was part of the larger rebuild: content, structure, presentation and practical features changed together.
I added tests and calculators so the experience could do more than present an article. A reader could use the material, practise or work through a calculation.
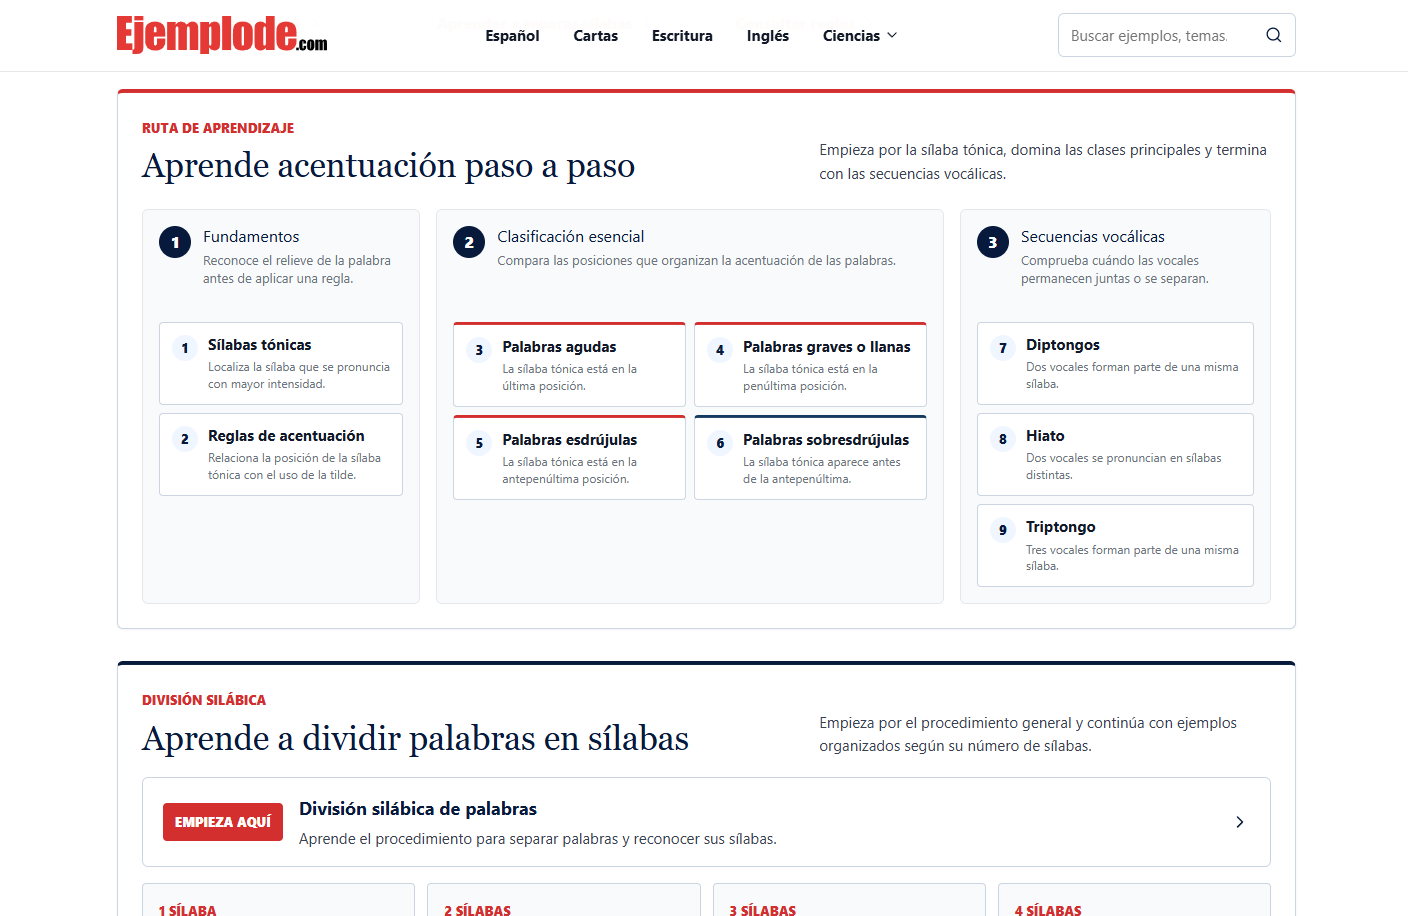
Pillar guides, a nine-step learning route and syllable-based navigation connect the articles around a clear learning task.
Open original image ↗Ortografía y acentuación: foundations, word classification and vowel sequences, followed by a dedicated syllable-division section. Screenshot supplied 4 October 2026.Explore the category ↗
In 2011, I worked through 50,000 URLs with spreadsheets and matching rules. In 2026, I could use Codex to support a much broader rebuild.
The tools changed. The difficult decisions were still mine.
What should stay? What should be combined? What no longer helped? What did the reader need that the site did not yet provide?
AI made the work possible at this scale. Experience helped me decide what work to do.
07 / THE FIRST RESULTS / UPDATED 18 OCTOBER 2026
Search is moving again.
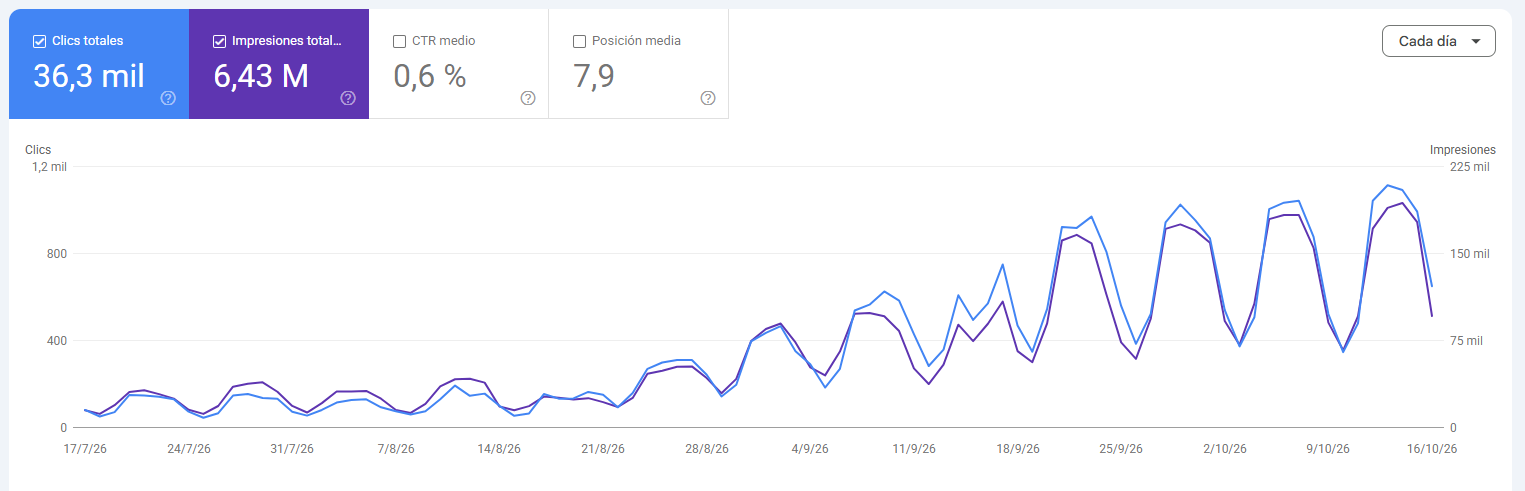
Clicks and impressions rose after the rebuild, with stronger daily peaks from late August.
The site is still far below its historic scale. The first signs are encouraging.
36.3KSearch clicks
6.43MSearch impressions
July–October 2026 · Google Search Console · Updated 18 October
Open original image ↗Web search · July–October 2026 · CTR 0.6% · Average position 7.9. Screenshot supplied 18 October 2026. Rounded totals cover the full reporting period, including days before the rebuild.
Visibility in a changing search experience.
The rebuild also had to account for AI-powered search. The content needed to be clear, connected and useful wherever a reader discovered it.
I see GEO as part of that work. It is another way to think about discovery, without losing sight of what happens after someone finds the answer.
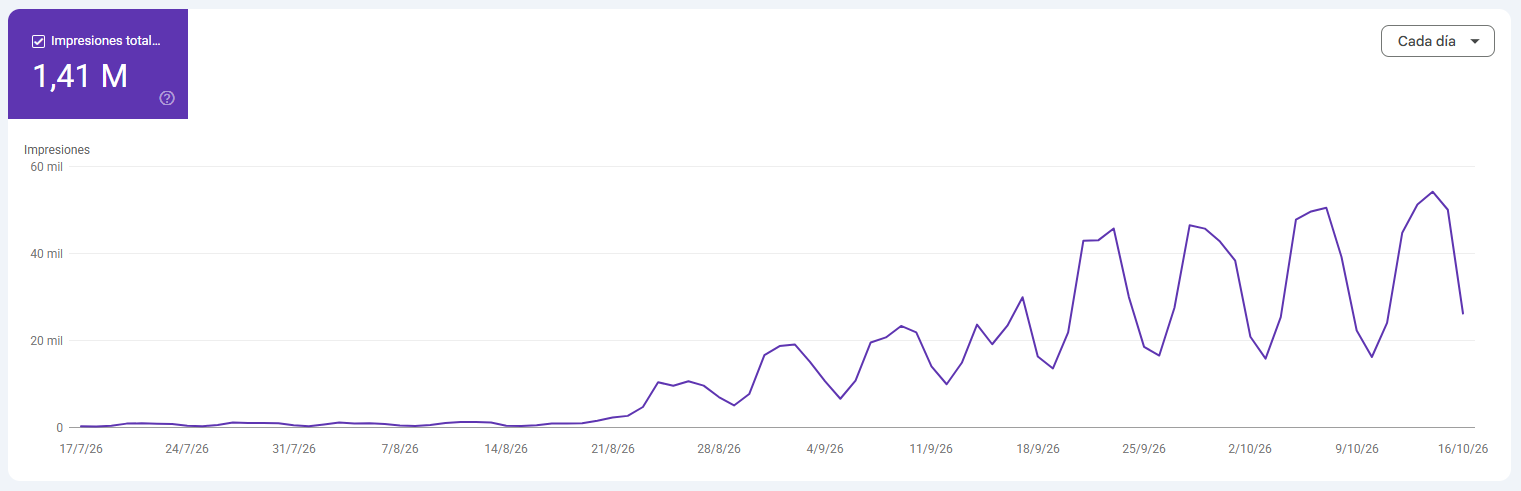
The Google AI Overviews visibility report below recorded 1.41M impressions across the July–October 2026 reporting window.
Open original image ↗Google AI Overviews visibility · July–October 2026 · Screenshot supplied 18 October 2026. The filter is not visible in this capture. Impressions are not visits; this figure is not added to the web-search total.
AI DISCOVERY / MEASURABLE TRAFFIC
People are arriving from AI assistants too.
The increase was not limited to Google. Visits identified from AI assistants rose in late August, around the same time as the search recovery and shortly after the new site went live.
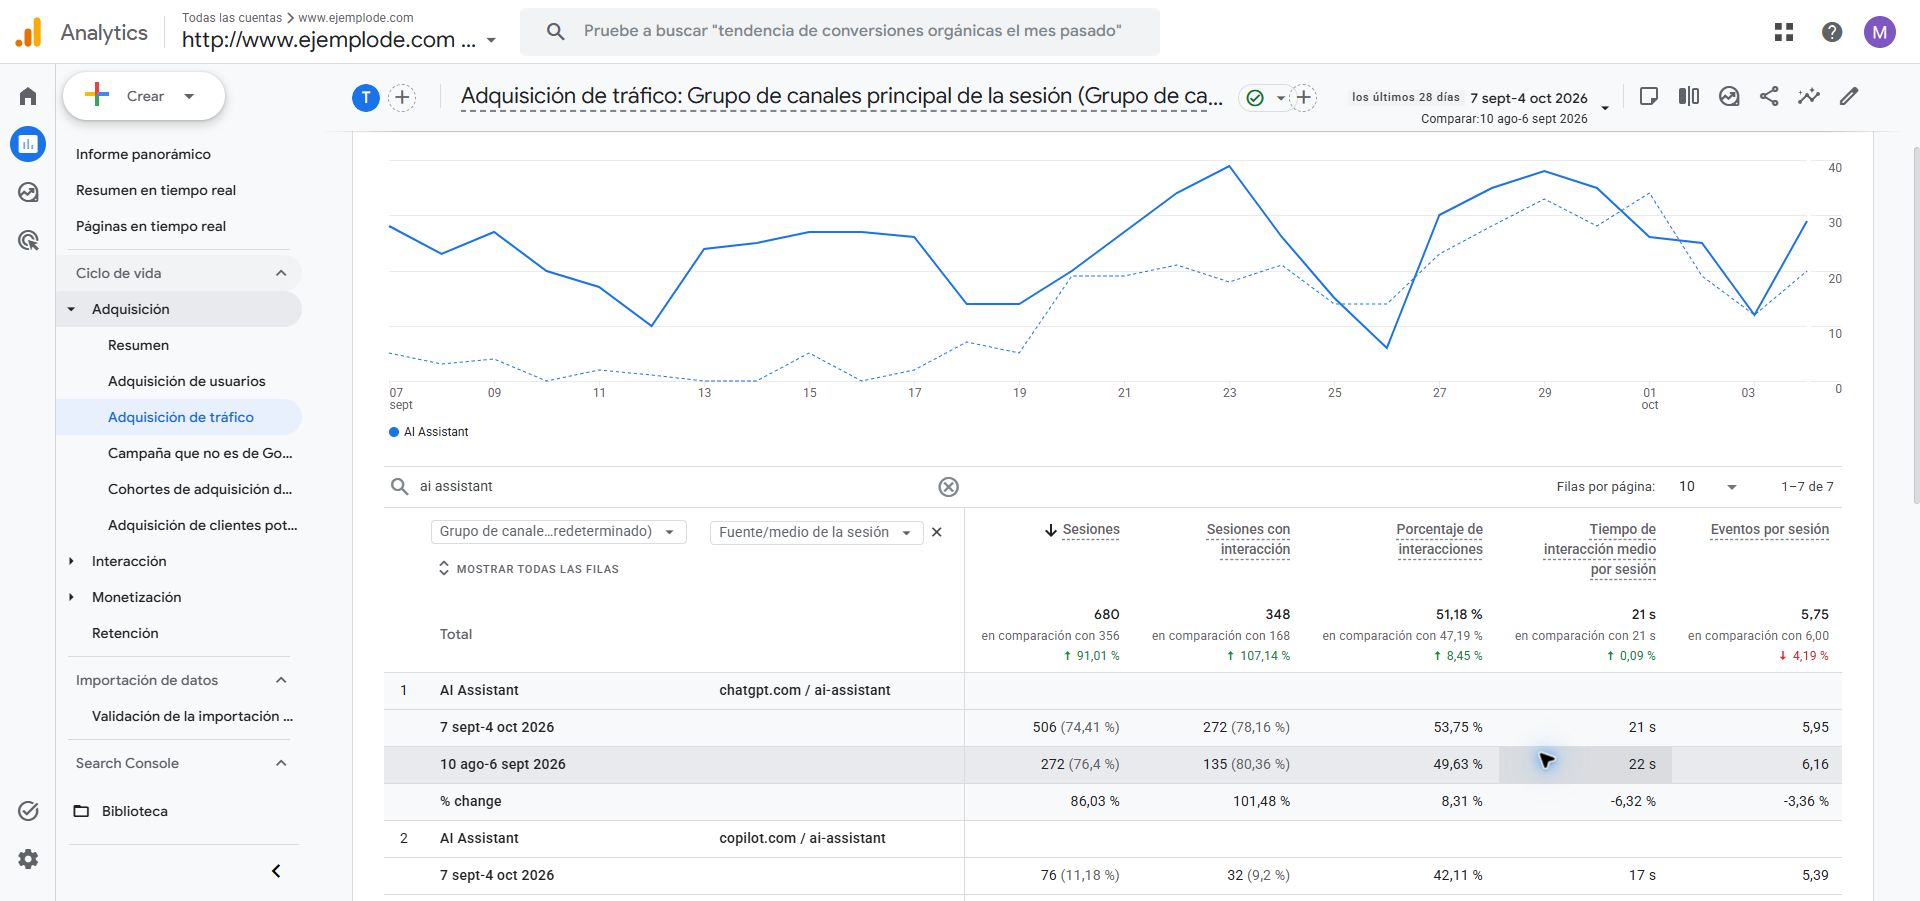
GA4 recorded 680 sessions from AI assistants in the latest 28 days, compared with 356 in the previous 28. That is a 91% increase, bringing the channel to nearly 1% of the site’s recorded sessions.
Not just appearing in answers. People are clicking through.
680AI assistant sessions · 28 days
+91%Versus the previous 28 days
0.96%Of all recorded site sessions
7 September–4 October 2026 · Google Analytics 4
Almost twice the traffic.Sessions from AI assistants · consecutive 28-day periods
10 Aug–6 Sep356
7 Sep–4 Oct680
0350700 sessions
Same scale, starting at zero. Exact increase: 91.01%. These periods do not isolate the launch effect.
WHERE THE VISITS CAME FROM
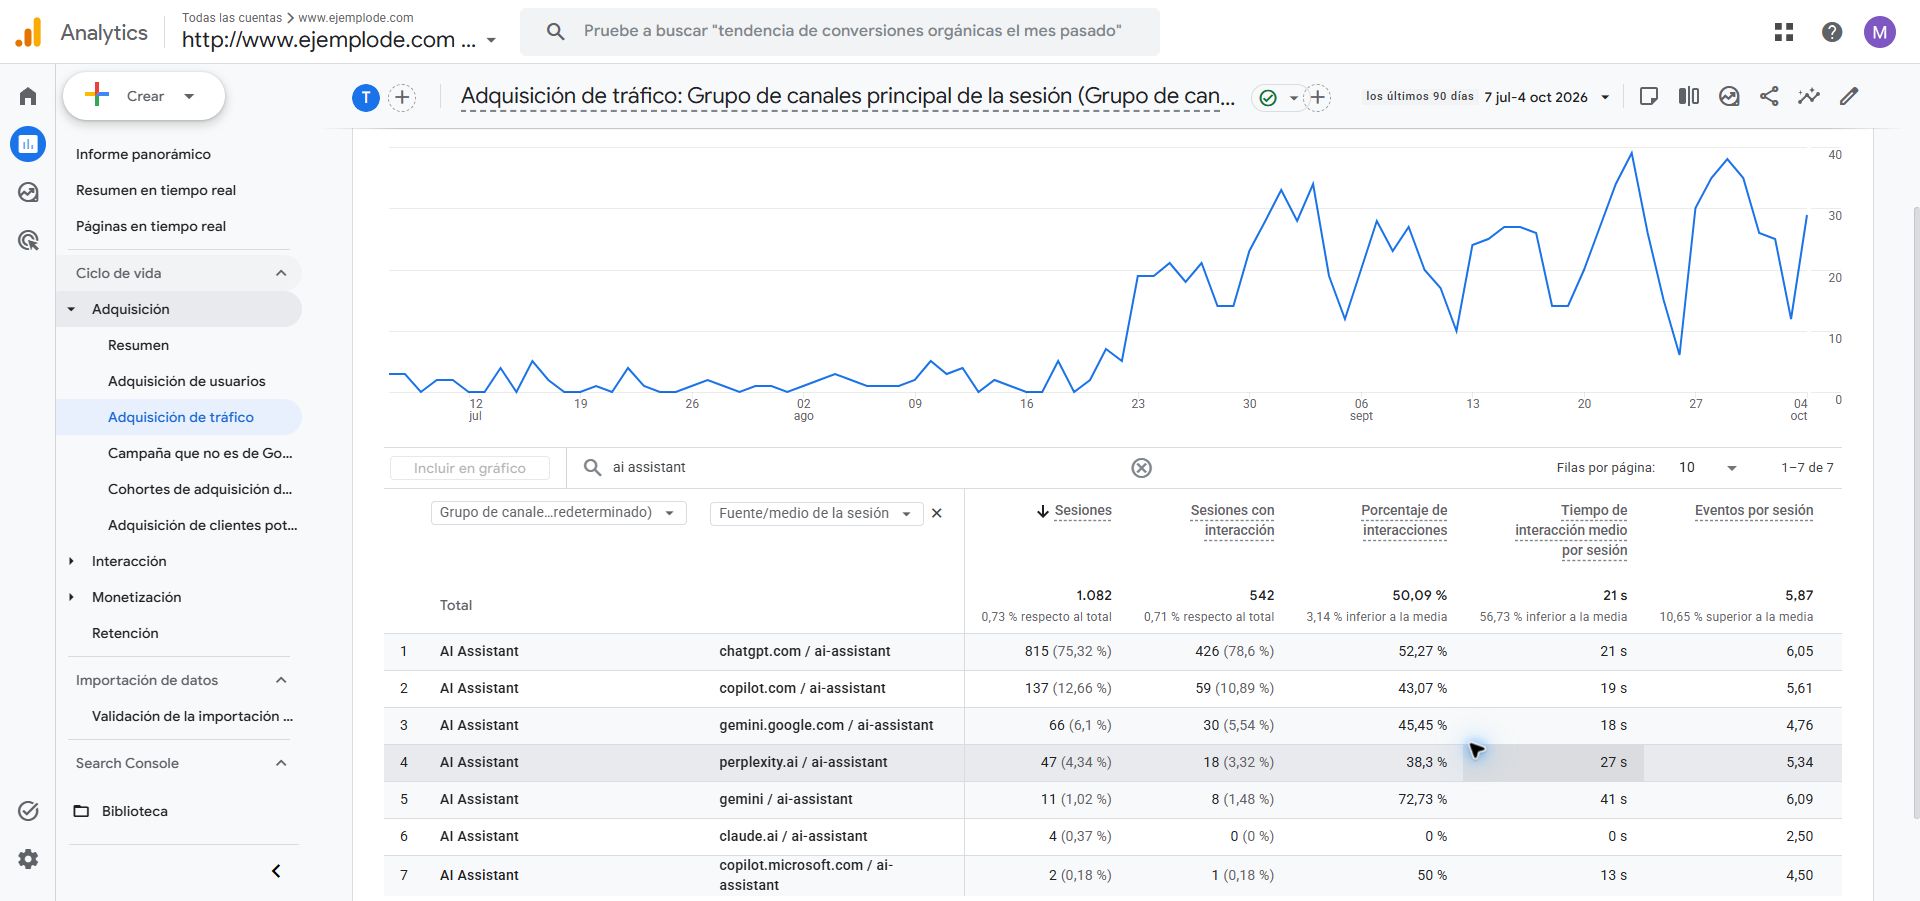
1,082 sessions · 7 July–4 October 2026 · 90 days
Assistant
Sessions
ChatGPT
815
Copilot
139
Gemini
77
Perplexity
47
Claude
4
Session source / medium. Copilot and Gemini each combine two source labels. This longer reporting period is separate from the 28-day comparison above.
ChatGPT was the largest source. Copilot, Gemini, Perplexity and Claude also brought visitors. Across the full 90-day report, these assistants accounted for 1,082 sessions.
I checked the sources at session level. Google’s AI Overviews and AI Mode belong to Organic Search in GA4, not its default AI Assistant channel. These are different measurements, not the same result counted twice.
The timing supports the recovery story. It does not prove which change caused it. The earlier comparison period already includes part of the rise, so this is not a clean before-and-after launch test.
See the GA4 sources and period comparison +Open original image ↗7 July–4 October 2026 · AI Assistant · Session source / medium. Original capture, verified 5 October 2026. The channel accounted for 0.73% of recorded sessions over these 90 days.Open original image ↗7 September–4 October versus 10 August–6 September 2026 · Equal 28-day periods. Engaged sessions rose from 168 to 348; engagement rate moved from 47.19% to 51.18%.
Search visibility is moving in the right direction. That is useful evidence after a period when smaller interventions had failed to change the picture.
But visibility, visits and revenue are different things. I do not treat an impression as a visit or a rising graph as proof that the business has fully recovered.
I also changed several things together. These charts show what happened after the rebuild. They do not isolate the contribution of every individual change.
The next test is whether that attention becomes a business again.
08 / THE WIDER NETWORK
The same experience. Different problems.
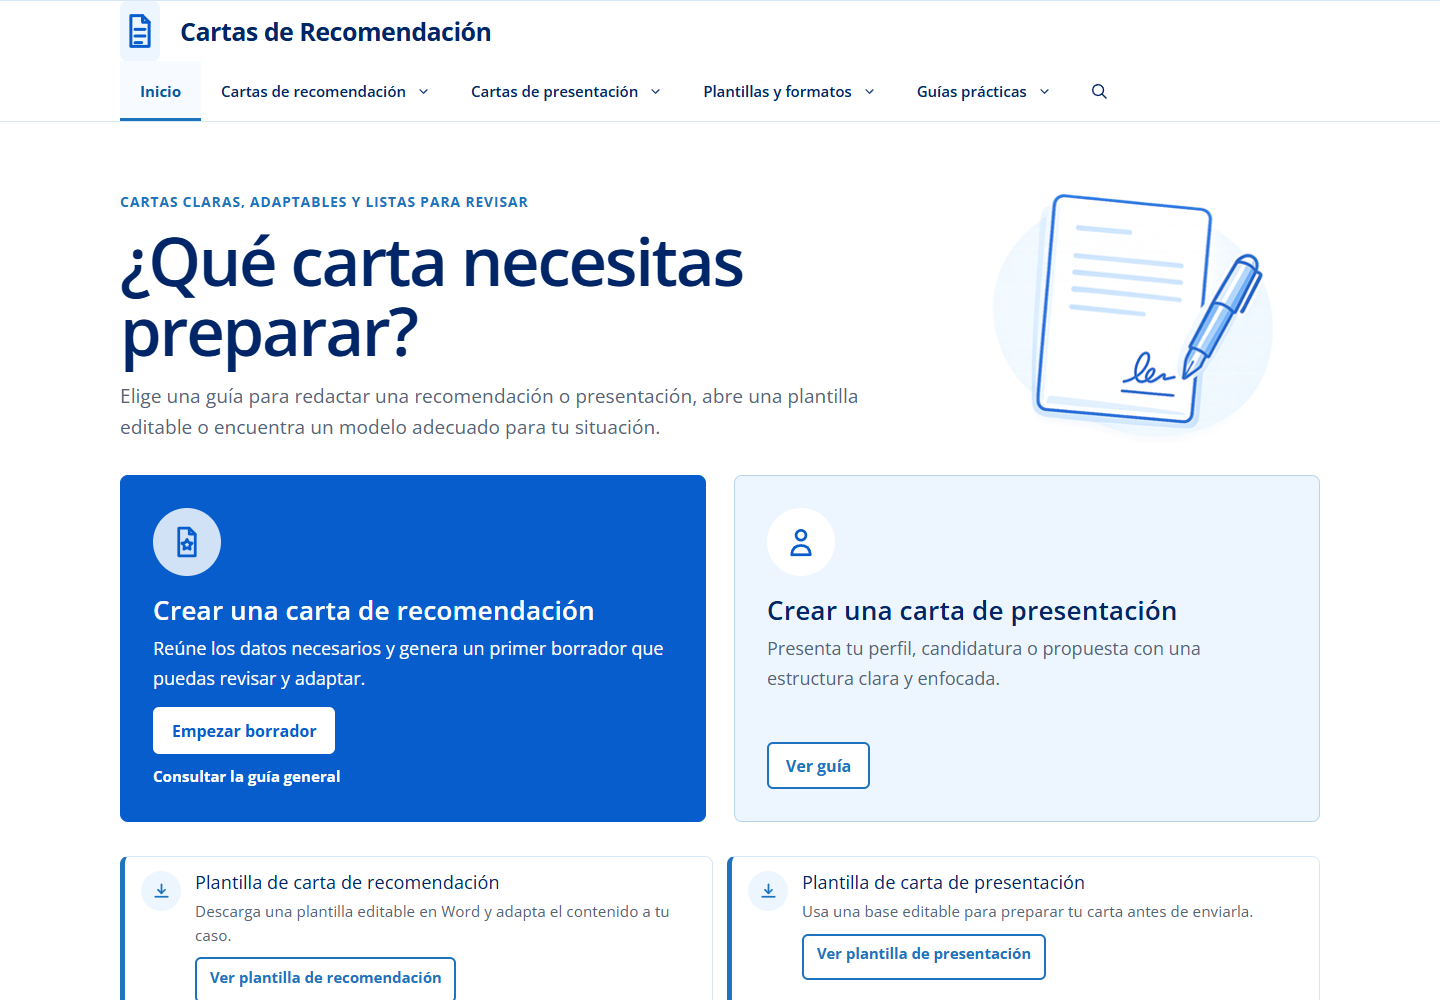
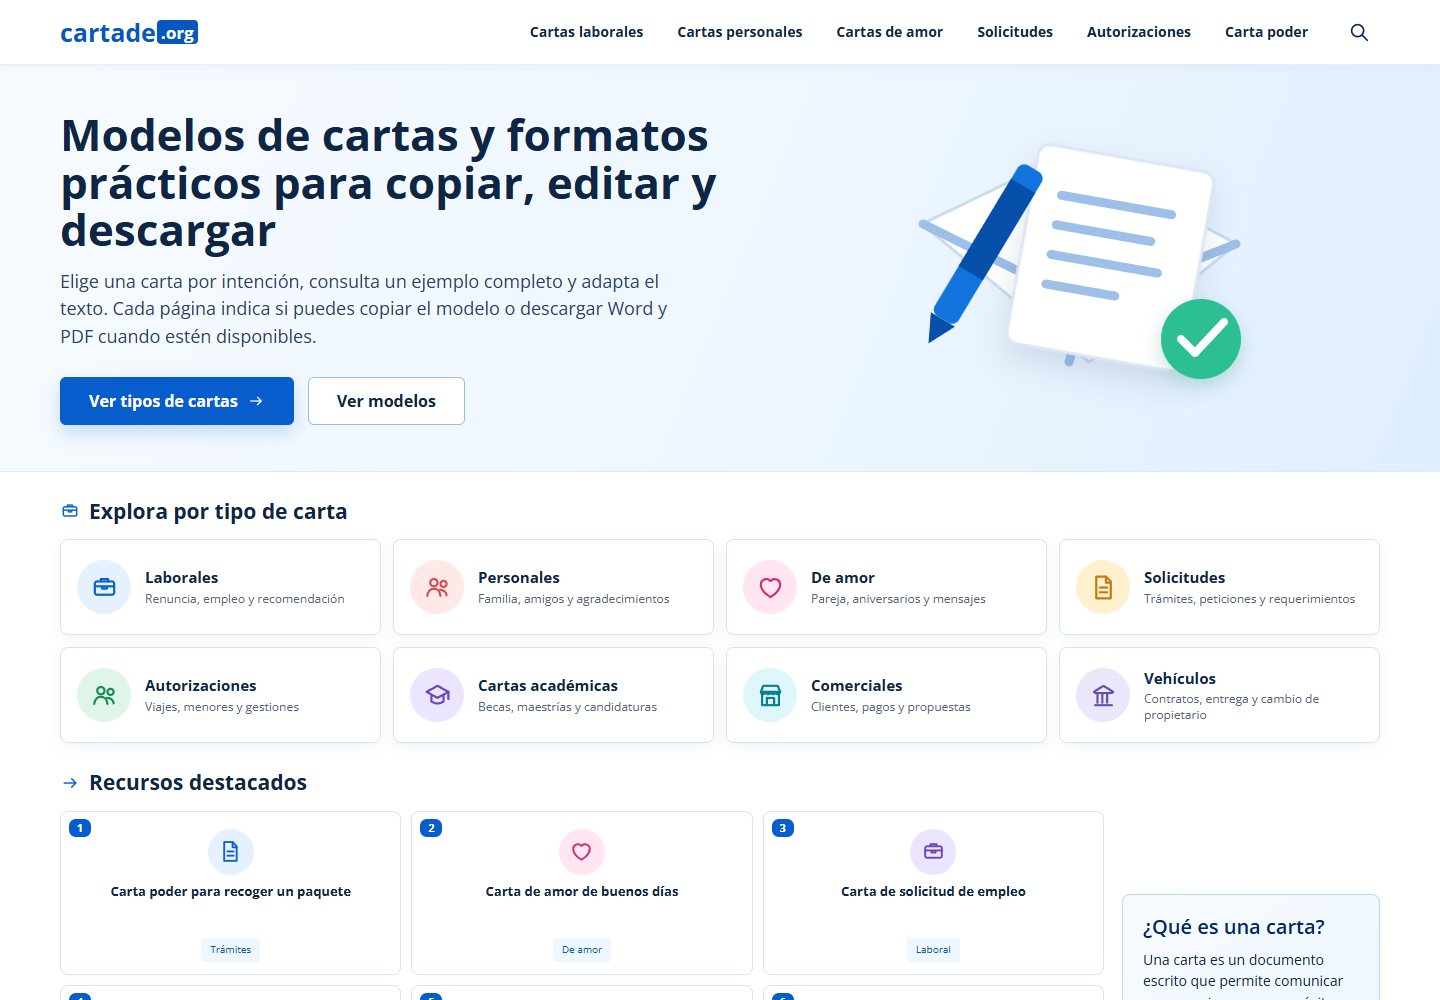
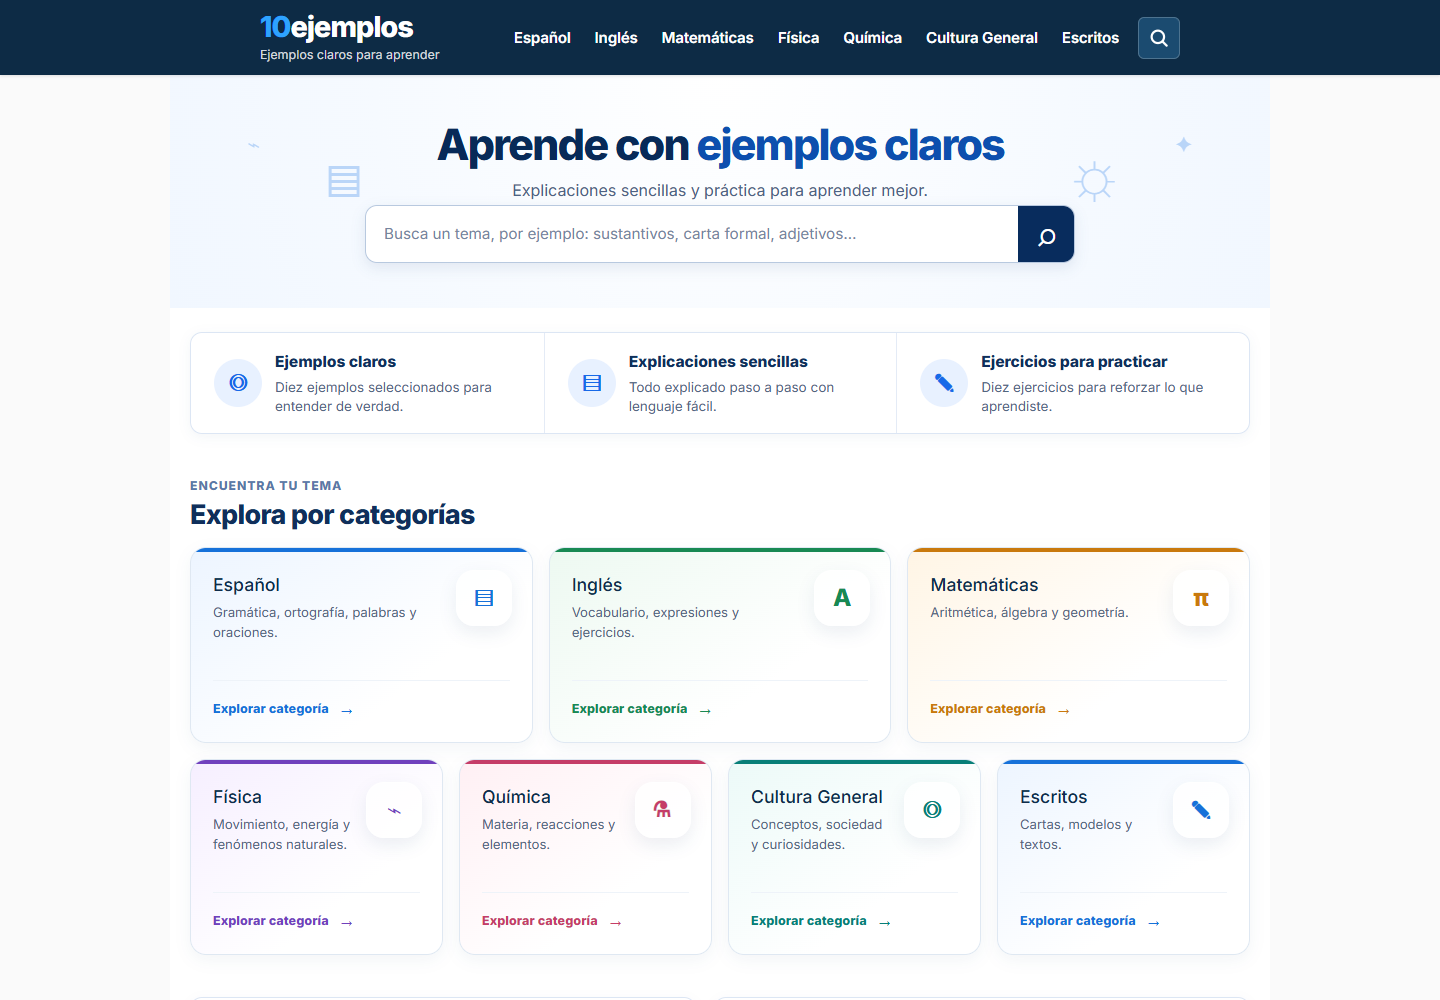
The modernisation started with Cartas de Recomendación, then CartaDe and 10ejemplos, before Ejemplode.
These sites share a history, but they do not all need the same product. Someone preparing a letter has a different task from someone learning a grammar rule.
What does the reader need to get done?
Cartas de Recomendación
Guides, editable templates and a tool to help readers prepare a draft.
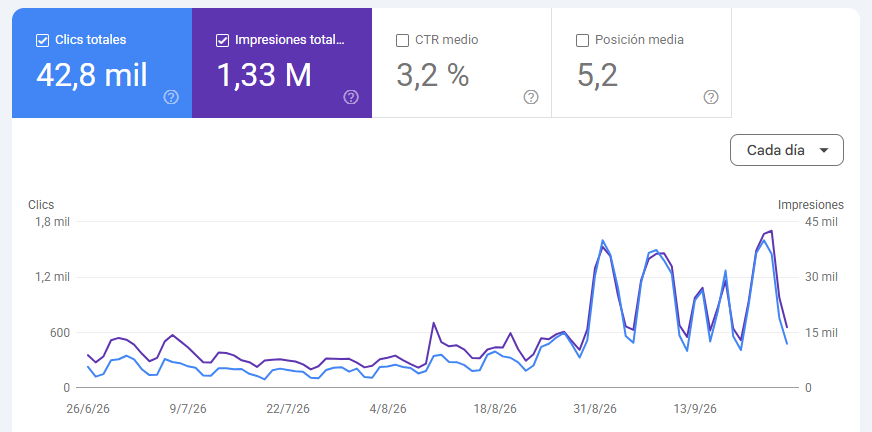
I fixed a technical SEO issue. Around three weeks later, search performance increased sharply.
Open original image ↗42.8K clicks and 1.33M impressions across June–September 2026. These are period totals, not the three-week uplift. The chart does not isolate the cause.
The results are not identical. Some sites are moving faster. Others still need work.
Keeping those differences visible matters. This is a portfolio of real businesses and ongoing decisions, not one result copied across several domains.
THE EXPERIENCE I BRING
I know the work behind the numbers.
I found the opportunity, built the platform and trained the people who helped it grow. I recovered the site after Panda. I also watched a successful model lose ground, and saw smaller attempts to fix it fail.
In 2026, I used that experience to rebuild the content and the product together, with AI making the scale of the work manageable.
That is the experience I bring to a team: understanding the business, choosing where to act and staying involved in the execution.